Know all the metrics associated with your different chats and start evaluating the effectiveness of your actions. Learn how the reporting module works, specifically the chat module, in this Article.
If you want to find information related to your chats 💬 you must go to the Reports module and select the Chats option. There, you will find different graphs that will show you the data extracted from your operation in B2Chat, reading them carefully and interpreting their figures will allow you to determine your team's capacity and optimize it to the resources that you need; additionally, you will be able to make better decisions 😎 for your company.
Learn how to review the reports and chats module by following these 👇 steps:
How to review the Reports module in B2Chat
Step 1: Log into B2Chat with your username and password🔐.
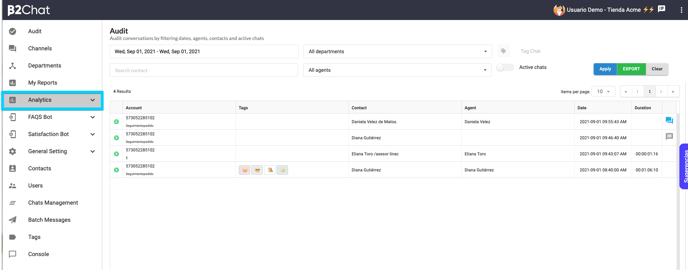
Step 2: Click on the Reports module, located at the bottom left of your screen.
 Step 3: Click on the submodule: "Chats".
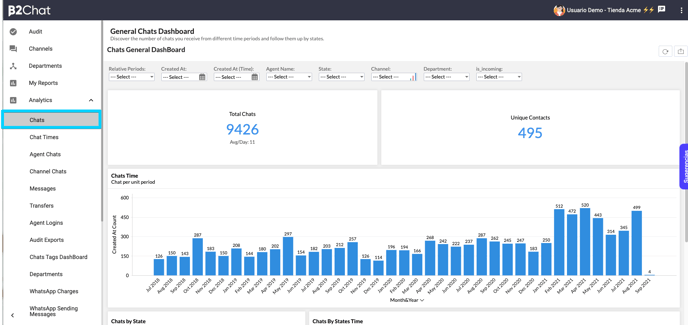
There, you will find a general report of the number of chats serviced by your business.

Once in the General chats dashboard, you will see a general chats report on your screen. You can view the number of chats you receive in different time periods as well as track them by their status.
Before you start reviewing your reports, you must first choose your search filters. Once they're activated, each report will show only the data you wish to view.
The filters you can activate are as follows:
* relative periods: with this filter you can limit the time period you wish to review with predefined time periods such as (This year, Today, This month ...).
* Created in: By selecting this filter you will be able to include in your search only chats created during a specific time period.
* Agent name: Here, you can include the agents you wish to review.
* Status: Thanks to this filter, you can include only chats that respond to a certain status.
* Channel: Here, you can choose chats belonging only to some of your communication channels.
* Department: With this filter, you can select only chats that belong to some of your business' departments.
* Is_incoming: With this last filter, you can view the chats' status you want to review, allowing you to choose between incoming or outgoing.
Step 4: When you choose your filters, you will see the number of chats your company has tended to since your account was first active in B2Chat. Let's say (7254) chats have been answered to date, under that number, you will find the amount of chats per day that are serviced on average. In the box on the right, you can see the number of unique contacts that have been serviced (6950), this allows you to determine customer recurrence, that is, how many are new customers and how many are returning customers.

In the box at the bottom, you will find the same amount of chats, but grouped by months included in the time period you've selected, here you can measure your business' traffic trend.

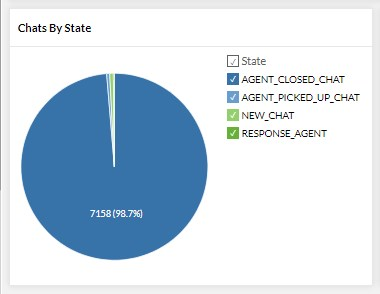
In the pie chart below, you can view the number of chats grouped by status:
NEW CHAT: New chats received by the console.
AGENT PICKED UP CHAT: The chat has been picked up by an agent.
RESPONSE AGENT: When an agent first responds to a chat.
AGENT CLOSED CHAT: When an agent closes a chat.

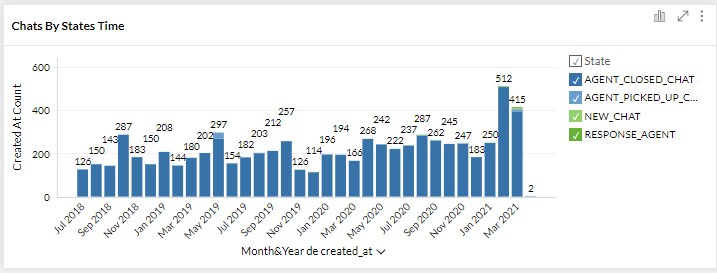
Finally, the last report that you are going to find is a merger of the previous last two reports, where you will find information on how chats are serviced, allowing you to observe month by month the chats by states time for each chat.

Easy! No?
If you have any additional questions regarding your reports' functions, do not forget to read our article "General use of reports in B2Chat".
