If you wish to have a better understanding of the statistics 📊 for your tags using the different graphs and reports available in B2Chat, you just need to follow these 👇 steps:
How to review your tag reports
⚠️Note: Keep in mind that to carry out the following process you must have an administrator user.
Step 1: Enter B2Chat with your username and password🔐.
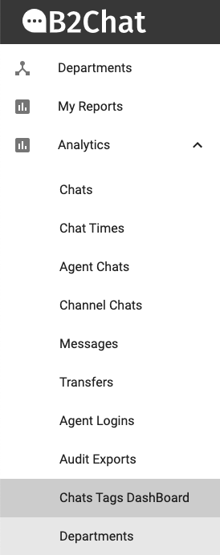
Step 2: Click on the Reports Module 📊, located in the upper left-hand side of your screen, and select the option: Chats Tags Dashboard.
Step 3: Once inside the reports module you will find four search bars 🔎 with different filters, select: first the date range 📆 that you wish to consult, then choose the tag's creation date 🏷️ , next, the department 👨💻 to which it belongs, and finally, the agent's name 👤 for whom you wish to review the reports.
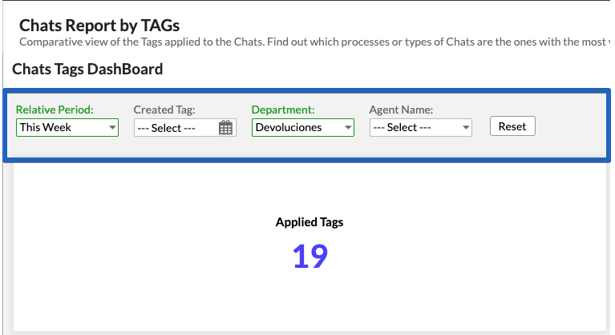
⚠️Note: You can fill in all the search fields or just some, you should not select all of them to view the tag reports 👀 but if you want to be very specific, you must fill them all.
Step 4: After selecting your search filters you will see different graphs with your reports 📈 divided like this:
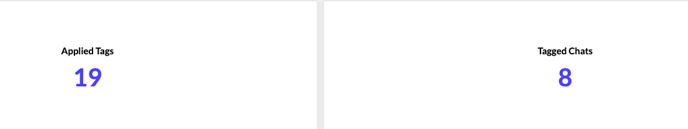
* Applied tags: refers to the number 🔢 of times that the tags have been applied in the chats that meet your 🔎 search.
* Tagged Chat: this report shows you the number of chats 💬 that have been tagged according to your search.
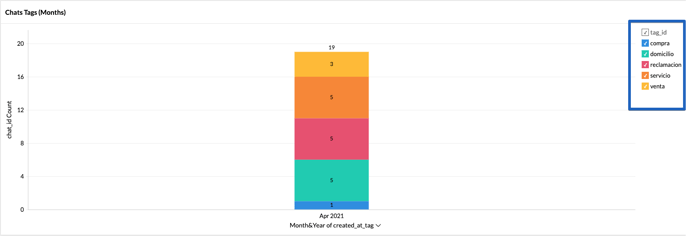
* Chats Tags (Months): In this report, you will see the number of times each tag was used in your different chats grouped month by month.
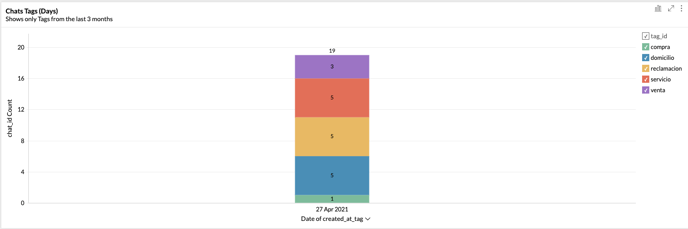
* Chats Tags (Days): Here you will see how many times each tag was used per day. This report is limited to showing only the days of the last 3 months.
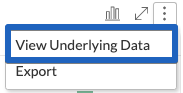
⚠️ Note: If you want to review your graphs in detail 📊 you can go to the top right hand side of each report and click on the icon with the three dots, and then select the option called: "See underlying data".
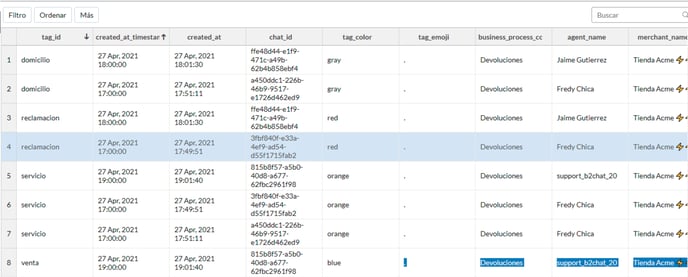
When you select this option, you will see a pop-up screen with an Excel file 📂 that shows, in different columns: the name of the tag 🏷️, the date the chat was tagged 📆, the creation date of the tagged chat, the ID for the chat that 💬 was tagged, the color 🎨 that identifies it, the department 👨💻 in which it was used, the agent 👤 that applied it and the name of the business where it was used, status of the tagged chat, name, email and mobile number of the contact associated with the tagged chat.
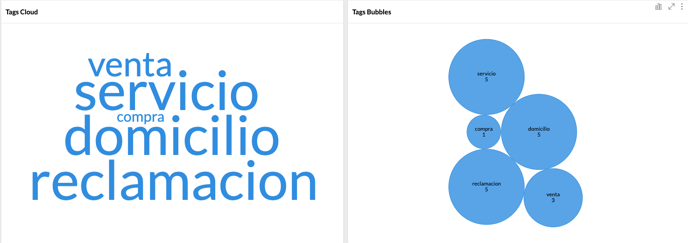
* Tags cloud: In this type of graph you will be able to compare 🔵 the progress for your different tags, the largest words being the most used ☁️ and the smallest being the least used.
* Tags bubbles: Finally, in this graph, 🔵 you will see comparatively, the number of times that your tags have been used in your chats.