Review the message flow your agents receive day after day and evaluate how your marketing actions influence your statistics. Learn about our Reports module in its "messages" version here.
If you wish to better understand your agents' workflow, you need to know in-depth the number of messages your company receives 💬 daily. In our reports module, you will find a section dedicated exclusively to messages, allowing you to check how many messages enter your lines each day and the speed 👍 with which they are serviced.
Learn to manage our Reports module in its "message" version by following these 👇 simple steps:
Messages report
⚠️Note: Keep in mind that, to carry out the following process you must have an administrator user.
Step 1: Log into B2Chat with your username and password🔐.
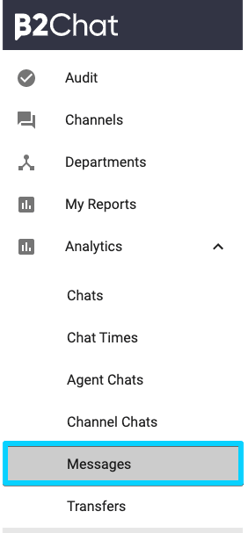
Step 2: Click on the "Reports module" 📊, located in the bottom left of your screen, and select the sub-module "Messages".

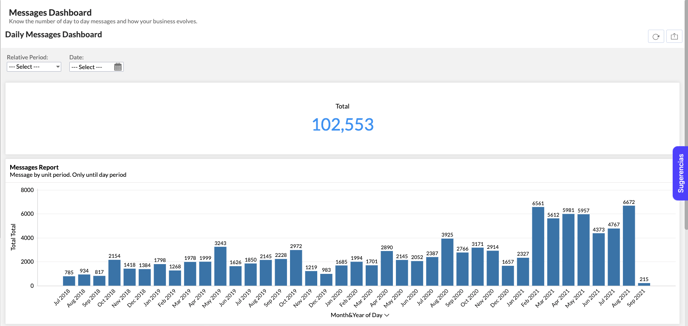
- Relative period: With which you can limit your report's data by dates 📆, selecting pre-configured periods such as: "This month", "Last three months", "This year", "Previous year", "Previous month" or "Last six months".
- Date: With which you can manually select ⚙️ the data's time period to be analyzed.

Step 4: Once you've selected your filters, you will see the total number of messages to date at the top of your screen.

Similarly in the graph called: "Message report" you will see the number of messages that your channels have received month by month.

In addition, in the "Messages Type Report" graphs located at the bottom of your screen, you can find information referring to messages grouped by message type, where they are classified by these two types:
1. Messages from chatbots (Total StdBotCount (: These are all the automatic messages that have been generated in conversations between the B2Chat chatbot and your customers.
2. Human interaction messages (Total ConsoleCount): All messages that occur within conversations between your advisors and your clients.
The goal for this classification is that you can measure the percentage of automation that chatbots are performing when you serve your customers.
⚠️ Note: Keep in mind that, if you want to filter your data to only view the numbers of chats that are attended by bots, you must check the green box ✅ that reads: "Total StdBotCount" located on the right side of your screen.

