Understanding in detail how your chats are mobilized within your company gives you an idea of how your customers' needs are resolved. In this article, you will learn how to manage the Reports module in its "transfer" version.
Find out which of your agents 👨💻 transfer the most chats, which receive the most transferred chats, and how long it takes your agents to resolve your clients' concerns, all from the Reports module in its version "Transfer".
Learn to review the Reports module, specifically its transfer version by following these simple steps:
Chats Transfer Report
⚠️Note: Keep in mind that, to carry out the following process you must have an administrator user.
Step 1: Log into B2Chat with your username and password🔐.
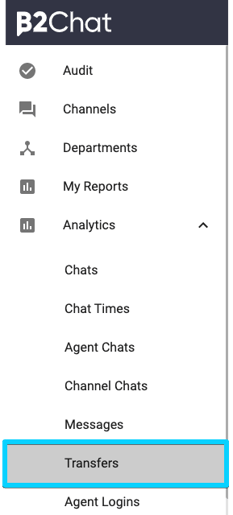
Step 2: Click on the Reports module 📊, located on the bottom left of your screen and select the sub-module "Transfers".
Step 3: Once inside the module, you will see a series of filters located at the top of your screen, activating them ✅ will allow you to refine your report's data. The following are filters you can use:
* Relative periods: With this filter, you can limit the time period you want to review with predefined periods such as This year, This month, Today, this week, previous week, yesterday, last 5 days, last 30 days).
* Transfer Date: This filter allows you to manually select date ranges for review.
* State: Here you can select the transfer status you wish to review.
* Agent Request: Thanks to this filter you can choose the agent that transfers the chats, for a more specific review.
* Agent Receiver: With this filter, you can choose the agent that receives the chats to review their processes individually.
* Department Request: With this filter, you can check the transfers made by a particular department.
* Department Receiver: With this filter, you can check the transfers that a particular department receives.
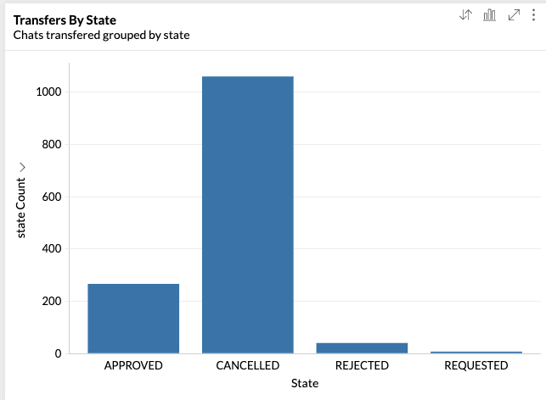
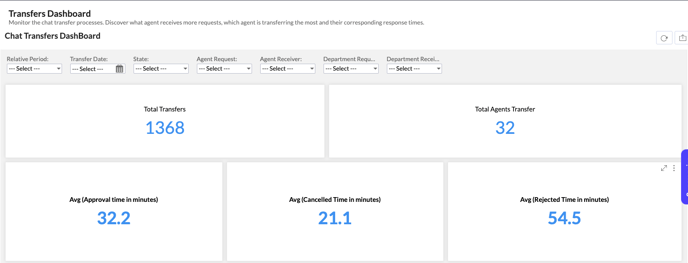 Step 4: Once you've finished selecting your filters, you will see a board with the following graphics:
The total number of transfers made in your B2Chat account:
The number of agents to whom chat transfers have been made:

These numbers tell you the average in minutes of approval time for each approved transfer, cancellation time for each canceled transfer, and rejection time for each rejected transfer:

The figures represented in the graph are grouped month by month and refer to chats that have been transferred by your agents. You can view the number of transfers for each month, grouped by status in different colors (Requested, Approved, Canceled, and Rejected).

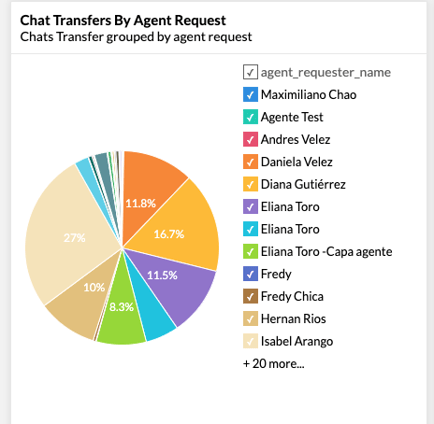
And a view of transfers grouped by agents who have requested a chat transfer. Here, you can identify which agents make the most transfers to analyze the causes and identify possible opportunities for improvement.
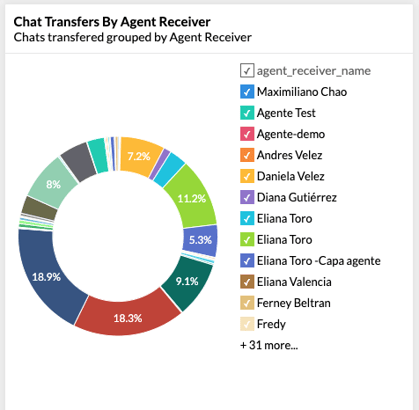
You will also be able to observe transfers grouped by the agents to whom the chats were transferred:
And finally, a graph that shows the total number of chats with an “Approved” status that have been transferred:
This is how your Transfers report is reviewed from the B2Chat platform, we hope that this information was useful to your company.
Thank you for placing your trust in us. 🤗
