With the agent logins report you will have an idea of how your agents use the B2Chat platform. You will understand their entry and exit routines, averages of permanence and much more. Learn how to manage this report here!
Understand how your agents log into the B2 platform.
Learn to review the agent logins report following these👇 simple steps:
Review each agent login
⚠️Note: Keep in mind that, in order to review this report you must have an administrator user within the B2Chat platform.
Step 1: Log into B2Chat with your username and password🔐.
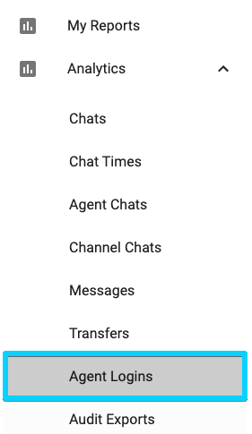
Step 2: Click on the Reports module and then click on the sub-module: "Agent Logins" located at the bottom left of your screen.

Step 3: Once inside the module, you will see a bar with filters at the top of your screen. Each filter allows you to refine 🔎 results for your reports. The available filters are:
- Relative period: With this filter, you can select the default time range 📆 that you want to include in your reports' results; The options to choose from are: This year, previous year, this month, previous month, last three months, last six months, this week, previous week, today, yesterday, last five days, last 30 days, others.
- Login date: With this filter, you can manually select ✍️ the date range you want to include in your reports.
- Agent: With this filter, you can choose the specific agent 👤 whose reports you wish to review.
- Type of event: With this filter, you can condition your search to only your agents' entries, exits, or log-outs, this way, you will only 👁️ see these actions in your results.
If you wish to clear the filters to get a general result in your reports again, or you just want to change the conditions, click the button: "Reset".
 Step 4: Once you finish setting up your filters, you will see two blue numbers just below each filter.
The first, "Login Count", shows you the number of times that users associated with your business have logged into the B2Chat platform.
The second number refers to the “Avg (Logins By Day) '' which shows you the average daily income 👍 for all users associated with your business.
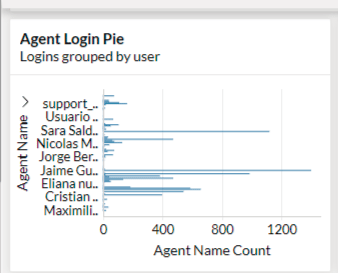
If you scroll down you will see a third report "Agent login Pie" where you can view a bar graph with the number of entries grouped by users 👤 associated with your business.

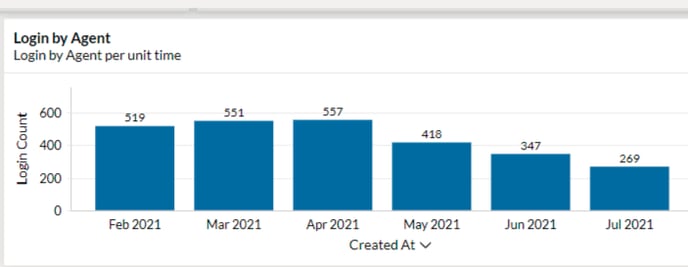
You will also find a report named "Login By Agent" 📊 in which you will see a bar graph with the total number of admissions for each of your agents grouped by months.
 Below, you will see a new report "Login grouped by Agents" where you will find the number of entries for each of your agents (Differentiated by color 🔵⚪) grouped by month.
If you wish to see the agent's name and their info in detail, you can position your mouse over the respective portion of the bar and a small window will pop up with all reports associated with that user.
 In the second to last report, “Session Events by Type” you will view a graph with the total number for the different events (income 🔵, session closings ✅ and expired sessions 🔴) grouped by month.
⚠️Note: You should bear in mind that, your agent sessions are automatically closed (expire) after 8 hours of being open, and for this reason, it is very important that you setup B2Chat automatic responses when you do not have active agents. To learn how to do this, read the article: How to manage my quick messages?
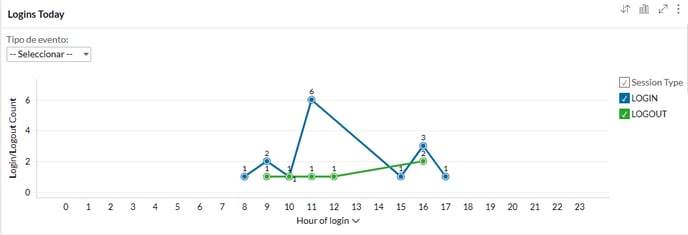
Finally, you will find one last report "Logins Today" where you can view data for your agents during the day 📆 or in progress, incoming and closing sessions are both in blue 🔵.

